Swiss Knife [MERT]Introduction
The Swiss Knife indicator is a comprehensive trading tool designed to provide a multi-dimensional analysis of the market. By integrating a wide array of technical indicators across multiple timeframes, it offers traders a holistic view of market sentiment, momentum, and potential reversal points. This indicator is particularly useful for traders looking to combine trend analysis, momentum indicators, volume data, and price action into a single, easy-to-read format.
---
Key Features
Multi-Timeframe Analysis : Evaluates indicators on Daily , 4-Hour , 1-Hour , and 15-Minute timeframes.
Comprehensive Indicator Suite : Incorporates MACD , Awesome Oscillator (AO) , Parabolic SAR , SuperTrend , DPO , RSI , Stochastic Oscillator , Bollinger Bands , Ichimoku Cloud , Chande Momentum Oscillator (CMO) , Donchian Channels , ADX , volume-based momentum indicators, Fractals , and divergence detection.
Market Sentiment Scoring : Aggregates signals from multiple indicators to provide an overall sentiment score.
Visual Aids : Displays EMA lines, trendlines, divergence signals, and a sentiment table directly on the chart.
Super Trend Reversal Signals : Identifies potential market reversal points by assessing the momentum of automated trading bots.
---
Explanation of Each Indicator
Moving Average Convergence Divergence (MACD)
- Purpose : Measures the relationship between two moving averages of price.
- Interpretation : A positive histogram suggests bullish momentum; a negative histogram indicates bearish momentum.
Awesome Oscillator (AO)
- Purpose : Gauges market momentum by comparing recent market movements to historic ones.
- Interpretation : Above zero indicates bullish momentum; below zero indicates bearish momentum.
Parabolic SAR (SAR)
- Purpose : Identifies potential reversal points in price direction.
- Interpretation : Dots below price suggest an uptrend; dots above price suggest a downtrend.
SuperTrend
- Purpose : Determines the prevailing market trend.
- Interpretation : Provides buy or sell signals based on price movements relative to the SuperTrend line.
Detrended Price Oscillator (DPO)
- Purpose : Removes trend from price to identify cycles.
- Interpretation : Values above zero suggest price is above the moving average; values below zero indicate it is below.
Relative Strength Index (RSI)
- Purpose : Measures the speed and change of price movements.
- Interpretation : Values above 50 indicate bullish momentum; values below 50 indicate bearish momentum.
Stochastic Oscillator
- Purpose : Compares a particular closing price to a range of its prices over a certain period.
- Interpretation : Values above 50 indicate bullish conditions; values below 50 indicate bearish conditions.
Bollinger Bands (BB)
- Purpose : Measures market volatility and provides relative price levels.
- Interpretation : Price above the middle band suggests bullishness; below the middle band suggests bearishness.
Ichimoku Cloud
- Purpose : Provides support and resistance levels, trend direction, and momentum.
- Interpretation : Bullish signals when price is above the cloud; bearish signals when price is below the cloud.
Chande Momentum Oscillator (CMO)
- Purpose : Measures momentum on both up and down days.
- Interpretation : Values above 50 indicate strong upward momentum; values below -50 indicate strong downward momentum.
Donchian Channels
- Purpose : Identifies volatility and potential breakouts.
- Interpretation : Price above the upper band suggests bullish breakout; below the lower band suggests bearish breakout.
Average Directional Index (ADX)
- Purpose : Measures the strength of a trend.
- Interpretation : DI+ above DI- indicates bullish trend; DI- above DI+ indicates bearish trend.
Volume Momentum Indicators (VolMom, CumVolMom, POCMom)
- Purpose : Analyze volume to assess buying and selling pressure.
- Interpretation : Positive values suggest bullish volume momentum; negative values indicate bearish volume momentum.
Fractals
- Purpose : Identify potential reversal points in the market.
- Interpretation : Up fractals may indicate a future downtrend; down fractals may indicate a future uptrend.
Divergence Detection
- Purpose : Identifies divergences between price and various indicators (RSI, MACD, Stochastic, OBV, MFI, A/D Line).
- Interpretation : Bullish divergences suggest potential upward reversal; bearish divergences suggest potential downward reversal.
- Note : This functionality utilizes the library from Divergence Indicator .
---
Coloring Scheme
Background Color
- Purpose : Reflects the overall market sentiment by combining sentiment scores from all indicators across different timeframes.
- Interpretation :
- Green Shades : Indicate bullish market sentiment.
- Red Shades : Indicate bearish market sentiment.
- Intensity : The strength of the color corresponds to the strength of the sentiment score.
Sentiment Table
- Purpose : Displays the status of each indicator across different timeframes.
- Interpretation :
- Green Cell : The indicator suggests a bullish signal.
- Red Cell : The indicator suggests a bearish signal.
- Percentage Score : Indicates the overall bullish or bearish sentiment on that timeframe.
Exponential Moving Averages (EMAs)
- Purpose : Provide dynamic support and resistance levels.
- Colors :
- EMA 10 : Lime
- EMA 20 : Yellow
- EMA 50 : Orange
- EMA 100 : Red
- EMA 200 : Purple
Trendlines
- Purpose : Visual representation of support and resistance levels based on pivot points.
- Interpretation :
- Upward Trendlines : Colored green , indicating support levels.
- Downward Trendlines : Colored red , indicating resistance levels.
- Note : Trendlines are drawn using the library from Simple Trendlines .
---
Utility of Market Sentiment
The indicator aggregates signals from multiple technical indicators across various timeframes to compute an overall market sentiment score . This comprehensive approach helps traders understand the prevailing market conditions by:
Confirming Trends : Multiple indicators pointing in the same direction can confirm the strength of a trend.
Identifying Reversals : Divergences and fractals can signal potential turning points.
Timeframe Alignment : Aligning signals across different timeframes can enhance the probability of successful trades.
---
Divergences
Divergence occurs when the price of an asset moves in the opposite direction of a technical indicator, suggesting a potential reversal.
- Bullish Divergence : Price makes a lower low, but the indicator makes a higher low.
- Bearish Divergence : Price makes a higher high, but the indicator makes a lower high.
The indicator detects divergences for:
RSI
MACD
Stochastic Oscillator
On-Balance Volume (OBV)
Money Flow Index (MFI)
Accumulation/Distribution Line (A/D Line)
By identifying these divergences, traders can spot early signs of trend reversals and adjust their strategies accordingly.
---
Trendlines
Trendlines are essential tools for identifying support and resistance levels. The indicator automatically draws trendlines based on pivot points:
- Upward Trendlines (Support) : Connect higher lows, indicating an uptrend.
- Downward Trendlines (Resistance) : Connect lower highs, indicating a downtrend.
These trendlines help traders visualize the trend direction and potential breakout or reversal points.
---
Super Trend Reversals (ST Reversal)
The core idea behind the Super Trend Reversals indicator is to assess the momentum of automated trading bots (often referred to as 'Supertrend bots') that enter the market during critical turning points. Specifically, the indicator is tuned to identify when the market is nearing bottoms or peaks, just before it shifts direction based on the triggered Supertrend signals. This approach helps traders:
Engage Early : Enter the market as reversal momentum builds up.
Optimize Entries and Exits : Enter under favorable conditions and exit before momentum wanes.
By capturing these reversal points, traders can enhance their trading performance.
---
Conclusion
The Swiss Knife indicator serves as a versatile tool that combines multiple technical analysis methods into a single, comprehensive indicator. By assessing various aspects of the market—including trend direction, momentum, volume, and price action—it provides traders with valuable insights to make informed trading decisions.
---
Citations
- Divergence Detection Library : Divergence Indicator by DevLucem
- Trendline Drawing Library : Simple Trendlines by HoanGhetti
---
Note : This indicator is intended for informational purposes and should be used in conjunction with other analysis techniques. Always perform due diligence before making trading decisions.
---
Cerca negli script per "RSI MACD"

OneThingToRuleThemAll [v1.4]This script was created because I wanted to be able to display a contextual chart of commonly used indicators for scalping and swing traders, with the ability to control the visual representation on the charts as their cross-overs, cross-unders, or changes of state happen in real time. Additionally, I wanted the ability to control how or when they are displayed. While looking through other community projects, I found they lacked the ability to full customize the output controls and values used for these indicators.
The script leverages standard RSI/MACD/VWAP/MVWAP/EMA calculations to help a trader visually make more informed decisions on entering or exiting a trade, depending on their understanding on what the indicators represent. Paired with a table directly on the chart, it allows a trader to quickly reference values to make more informed decisions without having to look away from the price action or look through multiple indicator outputs.
The main functionality of the indicator is controlled within the settings directly on the chart. There a user can enable the visual representations, or disable, and configure how they are displayed on the charts by altering their values or style types.
Users have the ability to enable/disable visual representations of:
The indicator chart
RSI Cross-over and RSI Reversals
MACD Uptrends and Downtrends
VWAP Cross-overs and Cross-unders
VWAP Line
MVWAP Cross-overs and Cross-unders
MVWAP Line
EMA Cross-overs and Cross-unders
EMA Line
Some traders like to use these visual indications as thresholds to enter or exit trades. Its best to find out which ones work the best with the security you are trying to trade. Personally, I use the table as a reference in conjunction with the RSI chart indicators to help me decide a logical trailing stop if I am scalping. Some users might like the track EMA200 crossovers, and have visual representations on the chart for when that happens. However, users may use the other indicators in other methods, and this script provides the ability to be able to configure those both visually and by value.
The pine script code is open source and itself is fairly straightforward, it is mostly written to provide the ultimate level of control the the user of the various indicators. Please reach out to me directly if you would like a further understanding of the code and an explanation on anything that may be unclear.
Enjoy :)
-dead1.

McClellan Indicators (Oscillator, Summation Index w/ RSI & MACD)Four indicators in one based on the McClellan Oscillator for both the NYSE and Nasdaq exchanges. Designed to be used in conjunction with each other- plot the Oscillator (Osc), Summation Index (MSI), and RSI/MACD of the MSI on both your SPX and Nasdaq chart. Select the exchange and indicator within the settings. These tools are secondary- but when the signals are combined with the action of the index and stocks can be helpful in identifying market turns and trend strength.
McClellan Oscillator--
The Osc is a market breadth tool that uses a fast and slow EMA based on the difference between advancing and declining stocks on the exchange. Used primarily to identify breadth thrusts, divergences, and extremes (oversold/overbought). Plot horizontal levels to see when the market internals are extremely overbought or oversold, and take note of when the Osc is declining while the market is advancing or vice versa.
McClellan Summation Index--
For intermediate trends the MSI is a running total of the Osc which can be used to confirm the strength of a trend, and spot potential reversals. A 10 period ema is included on this indicator, where crossovers can aid in spotting the change in trend of market internals, and divergences can identify when market internals are not in line with the trend. Shading is applied for when the internals are in a bullish or bearish trend.
Two additional indicators are the RSI and MACD of the Summation Index. An overbought or oversold MSI RSI generally indicates a strong trend in the market internals, however you may want to take note when the RSI stalls and begins to "hook" in the opposite direction. This indicator has signals to show when the market internals may be turning and to be on lookout for trend change.
Similarly- the MACD of the MSI identifies the strength of the trend, and crossovers can be used to help spot reversals. Shading is included in this indicator to spot the bullish/bearish trend of internals.

OBV with Volume/Momentum DivergenceCredits go to vyperphi696 and LazyBear for the original OBV with Divergence script.
This indicator has the new option to check for momentum divergence, which I have done by adding RSI and MACD data.
Hence the indicator allows combined testing of volume and momentum divergence. This feature aims to improve trend reversal detection by reducing false positives.
In summary, 3 divergence categories are shown by default as lines:
Volume + RSI + MACD (dark green/red)
Volume + RSI / Volume + MACD (light green/red)
Volume (gray)
Line colors can be adjusted via plot settings. Therefore it is also possible to distinguish Volume + RSI and Volume + MACD divergence if necessary.
Lastly, I edited the indicator scaling mechanism when changing from one timeframe to another; the transitions are smoother now. This only applies when auto-scaling is off.

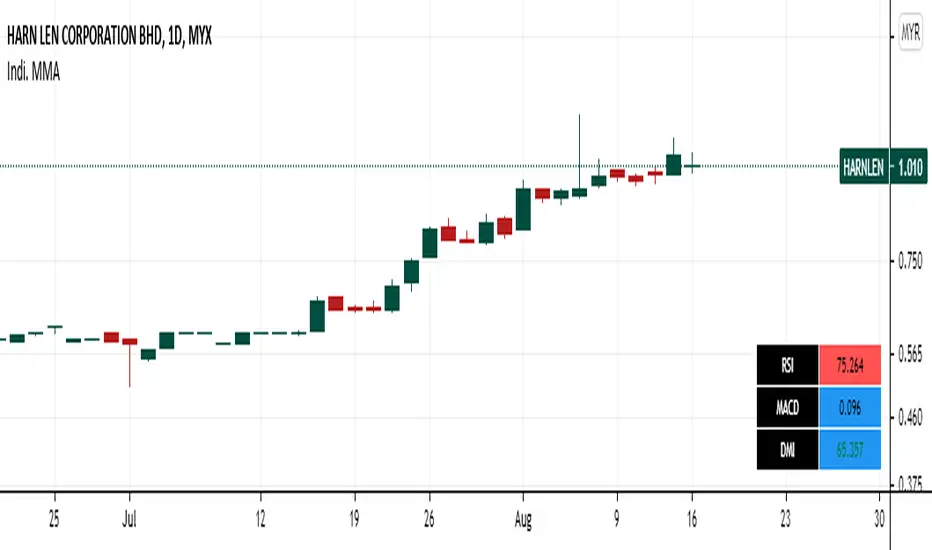
Panel RSI MACD DMI//RSI
//--Default length : 14
//--RSI > 70 : Background is RED
//--RSI < 30 : Background is GREEN
//--RSI Between 30 and 70 : Background is BLUE
//MACD
//--Default: 12,26,9
//--MACD cross above Zero Line / Signal Line : Background is GREEN
//--MACD cross below Zero Line / Signal Line : Background is RED
//--Others condition : Background is BLUE
//DMI
//--Default: 14, 14
//--ADX > 20 : Text is GREEN
//--ADX < 20 : Text is RED
//--DI+ > DI- : Background is BLUE
//--DI- > DI+ : Background is YELLOW
Forex scalper 2xEMA + SRSI + MACDThis is a forex scalping strategy designed for the most liquid pairs, like major forex pairs.
Its made of
1 EMA 50
1 EMA 100
Stochastic RSI
MACD
Rules
For long :close of the candle is above moving average 50, moving average 50> moving average 100, macd histogram is positive and cross over of stochastic rsi with the oversold level.
For short :close of the candle is below moving average 50, moving average 50 < moving average 100, macd histogram is negative and cross under of stochastic rsi with the overbought level.
Exit
For exit we have take profit and stop loss using fixed pip points.
For this example on EURUSD we use 20 pips for both tp and sl
IF you have any questions let me know !

{INDYAN} RSI + MACDModded RSI and MACD for intraday use. If rsi above 60 and macd is above zero line then go for buy and if rsi is below 40 and macd below zero line then go for sell side. use it in small timeframe i.e. 3 minute or less.
better for scalp trading
Happy Trading
Love INDYAN
#It can be used best with INDYAN Go With Trend

Multi momentum indicatorScript contains couple momentum oscillators all in one pane
List of indicators:
RSI
Stochastic RSI
MACD
CCI
WaveTrend by LazyBear
MFI
Default active indicators are RSI and Stochastic RSI
Other indicators are disabled by default
RSI, StochRSI and MFI are modified to be bounded to range from 100 to -100. That's why overbought is 40 and 60 instead 70 and 80 while oversold -40 and -60 instead 30 and 20.
MACD and CCI as they are not bounded to 100 or 200 range, they are limited to 100 - -100 by default when activated (extras are simply hidden) but there is an option to show full indicator.
In settings there are couple more options like show crosses or show only histogram.
Default source for all indicators is close (except WaveTrend and MFI which use hlc3) and it could be changed but for all indicators.
There is an option for 2nd RSI which can be set for any timeframe and background calculated by Fibonacci levels.

MACD and RSI divergence by Rexio v2Hi everyone!
I wrote this indicator for intraday trading and it cannot be use only by itself you need to at least draw some S/R lines to make it useful. It is based at MACD histogram and gives signal when it sees divergence on MACD/RSI/MACD's Histogram (or all at once - settings) when macd's histogram switchs trend. Im using it to playing with a trend most of the time looking for hidden divergence at higher time frame and after that looking for regular divergence at lower time frame.
Im not a computer programist nor professional trader so it is only for educational purposes only.

Take Profit XTake Profit X
Take Profit X solves the #1 problem in trading: knowing when to exit. Instead of guessing or using single indicators, it aggregates 8 technical signals to identify high-probability exit points through multi-confirmation consensus. This eliminates premature exits and emotional decision-making.
The indicator counts confirmations from your chosen technical tools:
Green dot = Multiple signals say "take profit on longs/exit shorts"
Red dot = Multiple signals say "take profit on shorts/exit longs"
Signals appear when you reach the minimum confirmations threshold you set.
Possible Settings:
Conservative (Swing Trading)
pine
Minimum Confirmations: 4
Use: RSI, MACD, CCI, Supertrend, Price Action
Disable: Stochastic, Bollinger Bands, EMA Cross
Look Back Bars: 10
Aggressive (Day Trading)
pine
Minimum Confirmations: 2
Use: All indicators ON
Look Back Bars: 3-5
RSI OB/OS: 75/25
Balanced (Most Markets)
pine
Minimum Confirmations: 3
Use: RSI, MACD, CCI, Supertrend
Price Action: ON
Look Back Bars: 5-7

Neural Fusion ProNeural Fusion Pro
Overview
Neural Fusion Pro is a multi-factor scoring system that combines numerous technical analysis methods into a single unified score. Rather than requiring traders to monitor multiple indicators separately, this system synthesizes trend strength, momentum oscillators, volume confirmation, price structure, and price action quality into one composite reading that adapts to current market conditions.
The Scoring System
At the heart of this indicator is a weighted scoring algorithm that produces a value between -1.0 and +1.0. Positive scores indicate bullish conditions across the measured factors, while negative scores suggest bearish conditions. The magnitude of the score reflects the strength of conviction across indicators.
The score is calculated from five distinct components, each capturing a different aspect of market behavior. Users can adjust the weight given to each component based on their trading style and market preferences.
Component 1: Trend Strength and Direction
This component uses the Average Directional Index to measure trend strength and the Directional Movement indicators to determine trend direction. When ADX exceeds the trending threshold, indicating a directional market, the component contributes a positive score if the positive directional indicator leads, or a negative score if the negative directional indicator leads. In ranging markets where ADX is low, this component contributes minimally to avoid false trend signals.
Component 2: Multi-Factor Momentum
Rather than relying on a single oscillator, this component synthesizes readings from RSI, MACD histogram, Stochastic, CCI, and Rate of Change. Each oscillator is normalized to a common scale and weighted according to its reliability characteristics. RSI readings are compared against dynamic thresholds that adjust based on trend state, making the indicator more forgiving in uptrends and more demanding in downtrends.
The component also includes divergence detection. When price makes a higher high but RSI makes a lower high (bearish divergence), or when price makes a lower low but RSI makes a higher low (bullish divergence), the divergence score adjusts the momentum component accordingly.
Component 3: Volume Confirmation
Volume provides crucial confirmation of price movements. This component analyzes On-Balance Volume relative to its moving average and measures the slope of OBV to determine whether volume is supporting the price trend. Additionally, it monitors relative volume by comparing current volume to its recent average, adding confirmation when volume spikes accompany price movements.
Component 4: Price Structure and Volatility
This component evaluates where price sits within the dynamic bands and considers the current volatility regime. When price is near the lower band, the component contributes a bullish score, suggesting potential support. When price is near the upper band, it contributes a bearish score, suggesting potential resistance.
The volatility regime assessment uses ATR percentile ranking. Low volatility periods often precede significant moves, while extremely high volatility may indicate unsustainable conditions.
Component 5: Price Action Quality
This component examines the character of recent candles by tracking the ratio of bullish to bearish candles over a lookback period. Consistent bullish price action contributes a positive score, while consistent bearish action contributes negatively. This helps filter signals by confirming that price behavior aligns with other factors.
Dynamic Bands
The indicator plots adaptive bands around a central basis line. The basis can be configured as either a simple or exponential moving average. Band width is determined by ATR multiplied by a dynamic factor that incorporates both ADX (expanding bands in trending markets) and the Chaikin Oscillator (expanding bands during strong accumulation or distribution).
These bands serve multiple purposes: they provide visual context for price position, they define signal trigger zones, and they help identify overextended conditions.
Trend State Detection
The indicator classifies market conditions into three states that affect signal generation and threshold levels.
Strong Uptrend is identified when ADX is rising, ADX exceeds the strong trend threshold, and the positive directional indicator exceeds the negative. This state triggers the most aggressive buy settings, allowing entries on shallow pullbacks.
Downtrend is identified when the negative directional indicator exceeds positive DI and ADX confirms directional movement. This state applies the most conservative buy settings, requiring deep oversold conditions before generating buy signals.
Neutral applies when neither trend condition is met, using moderate threshold settings appropriate for range-bound or transitional markets.
Dynamic RSI Thresholds
A key innovation is the automatic adjustment of RSI thresholds based on trend state. In a strong uptrend, the buy RSI threshold might be set to 50, allowing entries when RSI merely pulls back to neutral rather than requiring oversold conditions. The sell threshold rises to 72, keeping traders in positions longer during favorable conditions.
In downtrends, the buy RSI threshold drops to 25, ensuring buys only trigger on genuine capitulation. The sell threshold drops to 64, making exits easier to trigger.
In neutral markets, traditional oversold and overbought levels apply, with buy triggers around RSI 30 and sell triggers around RSI 68.
This adaptive approach prevents the common problem of indicators that work well in one market environment but fail in others.
Dynamic Cooldown
The signal cooldown period adjusts based on trend strength. During normal conditions, a standard cooldown prevents signal clustering. When ADX exceeds the strong trend threshold and is rising, indicating a powerful trend, the cooldown period extends. This helps traders stay in winning positions longer by reducing the frequency of counter-trend signals.
Cascade Protection
The indicator includes protection mechanisms to prevent overtrading and averaging down into losing positions.
The BBWP (Bollinger Band Width Percentile) monitor tracks current volatility relative to historical levels. When BBWP exceeds a threshold, indicating a volatility spike often associated with sharp moves, all buy signals are frozen. This protects against entering during panic selloffs or blow-off tops.
The consecutive buy counter tracks how many buy signals have occurred without an intervening sell. After reaching the maximum (default 3), no additional buy signals are generated until a sell occurs. This prevents the destructive pattern of repeatedly buying a declining asset.
Both protection mechanisms are displayed in the information panel, allowing traders to understand why signals may or may not be firing.
Signal Generation
Buy signals require price to touch or penetrate the lower band, RSI to be below the dynamic threshold, and the market to be in a trending state (when that filter is enabled). Additionally, the cooldown period must have elapsed and cascade protection must not be blocking buys.
Sell signals require price to touch or penetrate the upper band, RSI to be above the dynamic threshold, and the cooldown to have elapsed.
Signal labels display the entry price, signal type (shallow dip, capitulation, extended, bounce sell, or neutral), and the current position in the consecutive buy count.
Visual Components
The indicator provides multiple layers of visual feedback.
Cloud shading between the bands changes based on whether the composite score is in a buy zone or sell zone. Green clouds indicate bullish score readings, while red clouds indicate bearish readings.
Background coloring reflects the overall market regime. Green background indicates a bullish regime (positive DI leadership with volume confirmation), red indicates bearish regime, and white indicates neutral conditions.
An ADX bar at the bottom of the chart uses color coding: white for ranging (very low ADX), orange for flat, and blue for trending conditions.
The information panel displays the composite score with color coding, current trend state, active RSI thresholds, divergence status, BBWP freeze status, buy counter, market regime, ADX value with trend indicator, current cooldown setting, and live RSI reading color-coded against the active thresholds.
A debug panel can be enabled to show the individual component scores, helping users understand what is driving the composite reading.
How to Use
Monitor the composite score in the information panel. Readings above the buy threshold combined with price near the lower band represent potential long entries. Readings below the sell threshold with price near the upper band suggest exit opportunities.
Pay attention to the trend state. In strong uptrends, be more willing to buy dips and more patient with holding positions. In downtrends, require stronger confirmation before entering and be quicker to take profits on bounces.
Watch the cascade protection status. If BBWP shows frozen or the buy counter is approaching maximum, exercise additional caution regardless of other signals.
Use the dynamic RSI thresholds as context. When the panel shows buy RSI threshold at 50 (strong uptrend), even a pullback to RSI 45 is a potential entry. When the threshold shows 25 (downtrend), wait for genuine capitulation conditions.
Component Weight Adjustment
The relative importance of each scoring component can be adjusted through the settings. The default weights emphasize trend strength (30%) and momentum (25%), with volume (20%), price structure (15%), and price action (10%) providing confirmation.
For trend-following strategies, consider increasing trend and momentum weights. For mean-reversion approaches, increase the price structure weight to emphasize band position. The weights should sum to approximately 1.0 for proper score scaling.
Settings Guidance
The default settings are calibrated for cryptocurrency markets on lower timeframes. For traditional markets or longer timeframes, consider adjusting the ADX trending threshold (lower values for less volatile assets), the dynamic RSI levels for each trend state, and the cascade protection parameters.
The Heikin Ashi option for band calculation can provide smoother bands but may introduce slight lag. The default setting uses standard price data for better real-time accuracy.

3rd Candle Coach – VWAP/ORB Tool3rd Candle Coach, VWAP and ORB Logic Script
This script helps you spot clean setups by checking your key conditions at the same time. It shows a simple pass or fail for each piece and prints a signal only when everything agrees.
What this script checks:
1. **3 Candle Breakouts from VWAP, Volume Weighted Average Price, or ORB, Opening Range Breakout**
* Needs two full candles above or below VWAP or ORB
* Third candle must follow in the same direction
* Marks the setup once all three confirm
2. **Trend Using EMAs, Exponential Moving Averages (9 and 21)**
* Shows if the fast EMA is above or below the slow EMA
* Can confirm if the EMAs support the trade direction
3. **Momentum Using RSI, Relative Strength Index, and MACD, Moving Average Convergence Divergence**
* RSI must clear your level for longs or shorts
* MACD must agree with the direction
4. **Volume Check, Simple and Relative Volume Comparison**
* Compares current volume to a volume moving average
* Can check relative volume for strength
5. **Higher Timeframe Trend Using HTF EMA, Higher Timeframe Exponential Moving Average**
* Shows larger trend direction for bias
6. **Session Timing Filter, Session Based Signal Control**
* Lets signals fire only inside your chosen session window
7. **ATR Extension Check, Average True Range Distance from VWAP or ORB**
* Measures how far price has stretched from VWAP or ORB using ATR units
* Blocks signals when the move is too extended
8. **Long and Short Signal Markers, Directional Trade Alerts**
* Prints a long marker when all enabled conditions pass
* Prints a short marker when all enabled conditions pass
9. **Condition Breakdown Panel, Real Time Pass or Fail Table**
* Shows pass or fail for trend, RSI, MACD, volume, relative volume, higher timeframe bias, session, and extension
10. **Explanation Labels, Signal Reasoning Summary**
* When a signal fires, a label shows which conditions triggered it
---
This script gives you a clean checklist and one clear signal only when everything lines up. It helps you see the setup form step by step and keeps your chart easy to read.
---
note:
I built this to help you spot when indicators actually agree. It is mainly a training script. Alerts on the one minute fire a lot, so turn them off or use a five minute chart. You can turn almost everything off to keep it as simple or strict as you want.

Easy Crypto Signal FREE🆓 FREE Bitcoin & Crypto Trading Indicator
Easy Crypto Signal FREE helps you make better trading decisions with real-time BUY/SELL signals based on multiple technical indicators.
✅ What you get in FREE version:
• Real-time BUY/SELL signals (green/red arrows)
• Trading SCORE (0-100%) - market strength indicator
• Works on BTC, ETH, and all major altcoins
• Optimized for 4h timeframe (works on all timeframes)
• Simple visual interface
• Basic alert system
📊 How it works:
The indicator combines RSI, MACD, EMA trends, and volume analysis to generate a composite SCORE (0-100%).
• SCORE > 65% = BUY signal 🟢
• SCORE < 35% = SELL signal 🔴
• SCORE 35-65% = WAIT (neutral zone) 🟡
⚠️ FREE Version Limitations:
• No detailed RSI values
• No MACD trend details
• No trend strength indicators
• Fixed sensitivity (65%)
• Limited customization
💎 Want the FULL PRO version?
🚀 PRO includes:
• Full RSI + MACD + Trend analysis displayed
• Customizable sensitivity (40-80%)
• Advanced alert customization
• Professional clean interface
• Volume strength indicator
• NO watermarks
• Premium support
📊 Proven Backtest Results:
• 57.1% Win Rate
• 3.36 Profit Factor (Excellent)
• +9.55% return in 3 months
• Only -2.69% Max Drawdown (Low Risk)
🔗 Get PRO version:
📈 Best practices:
1. Use on 4h timeframe for best results
2. Combine with your own analysis
3. Always set Stop Loss (5-10%)
4. Test on demo account first
5. Don't trade based on signals alone
⚠️ Risk Disclaimer:
Cryptocurrency trading involves substantial risk. This indicator is for educational purposes only and does not guarantee profits. Past performance does not indicate future results. Always do your own research and never invest more than you can afford to lose.
📧 Questions or Feedback?
Comment below or message me directly!
🌟 If you find this helpful, please give it a like and share!
v1.0 - Initial FREE release
• Basic BUY/SELL signal system
• Score indicator 0-100%
• Optimized for 4h timeframe
• Works on all crypto pairs

Ichimoku_RSI_MACD_CleanIchimoku + RSI + MACD. A combination of three indicators. The important thing is that they have a BUY or SELL alert, so it makes it easy to understand the numbers.

Ichimoku_RSI_MACDIchimoku cloud + RSI + MACD. Combined indicators with signals, indicating whether it is bullish or bearish (BUY or SELL).

🔥 QUANT MOMENTUM SKORQUANT MOMENTUM SCORE – Description (EN)
Summary: This indicator fuses Price ROC, RSI, MACD, Trend Strength (ADX+EMA) and Volume into a single 0-100 “Momentum Score.” Guide bands (50/60/70/80) and ready-to-use alert conditions are included.
How it works
Price Momentum (ROC): Rate of change normalized to 0-100.
RSI Momentum: RSI treated as a momentum proxy and mapped to 0-100.
MACD Momentum: MACD histogram normalized to capture acceleration.
Trend Strength: ADX is direction-aware (DI+ vs DI–) and blended with EMA state (above/below) to form a combined trend score.
Volume Momentum: Volume relative to its moving average (ratio-based).
Weighting: All five components are weighted, auto-normalized, and summed into the final 0-100 score.
Visuals & Alerts: Score line with 50/60/70/80 guides; threshold-cross alerts for High/Strong/Ultra-Strong regimes.
Inputs, weights and thresholds are configurable; total weights are normalized automatically.
How to use
Timeframes: Works on any timeframe—lower TFs react faster; higher TFs reduce noise.
Reading the score:
<50: Weak momentum
50-60: Transition
60-70: Moderate-Strong (potential acceleration)
≥70: Strong, ≥80: Ultra Strong
Practical tip: Use it as a filter, not a stand-alone signal. Combine score breakouts with market structure/trend context (e.g., pullback-then-re-acceleration) to improve selectivity.
Disclaimer: This is not financial advice; past performance does not guarantee future results.

FVG Zones with Signals█ OVERVIEW
"FVG Zones with Signals" is a technical analysis tool that identifies Fair Value Gaps (FVG) on the chart and draws customizable zones in the form of boxes. It is ideal for traders using price action and market structure strategies, helping to identify potential imbalance zones and trading opportunities based on breakout and exit signals. With flexible size filter settings, box styles, and signal options, the indicator ensures clarity and precision on the chart.
█ CONCEPTS
The indicator is designed to identify potential entry points for trades based on FVG breakouts or retests. For chart clarity, a size filter for FVGs is included, based on a multiplier of the average candle size over a specified period.
Why are FVGs important? FVG zones represent areas of market imbalance, often attracting price back to "fill" the gap. Larger gaps (with a higher size multiplier) have a greater chance of being retested, as they indicate deeper imbalances—leaving more unexecuted orders in those zones, which attracts liquidity. Market makers and institutions often return to these levels to "refresh" liquidity before further moves. However, not every large FVG is retested quickly—in strong trends, smaller imbalances may be ignored, and the location (e.g., near swing highs/lows) is critical for retest probability.
█ FEATURES
- FVG Detection: Identifies bullish and bearish FVGs based on size filters (Candle Size Period and FVG Size Multiplier), with automatic initialization of historical gaps up to 500 candles back.
- Customizable Boxes: Draws FVG boxes with adjustable border colors, background gradients, border styles (solid, dashed, dotted), border widths, and transparency for both the background and the 50% FVG midline.
- Breakout and Exit Signals: Generates "Break" signals (green upward triangle for breakouts above bearish FVG, red downward triangle for breakouts below bullish FVG) and "Exit" signals (circles for exiting the zone), with options to select signal types (Break, Exit, or Both). A break signal causes the box to disappear, leaving a triangle as a trace of the breakout, which may serve as a signal to open a position. Exit signals (circles) may also indicate entry opportunities but require additional confirmation, such as alignment with the main trend.
- Midline: Automatically draws a dashed line at the 50% FVG level with adjustable transparency, aiding in assessing price reactions within the zone.
- Box Limitation: Automatically removes old or inactive FVGs after 500 candles to avoid chart clutter.
- Alerts: Built-in alerts for all signal types, including price and FVG type descriptions.
█ HOW TO USE
Add to Chart: Apply the indicator to your TradingView chart via the Pine Editor or Indicators menu.
Configure Settings:
- FVG Settings: Adjust Candle Size Period (default 20) and FVG Size Multiplier (default 1) to filter out small gaps—higher values generate fewer but more significant FVGs.
- Box Settings: Configure colors and styles for bullish (green) and bearish (red) boxes, including background transparency (default 80) and midline transparency.
- Signal Settings: Select signal types (Break, Exit, or Both) in Signal Type. Breakout signals appear after a candle closes outside the zone, while exit signals appear when exiting an FVG without a full breakout.
- Styling: Customize signal colors (green for buy/up, red for sell/down) and shape sizes.
Interpreting Signals:
- Break Up Signal: A green triangle below the bar indicates a breakout above a bearish FVG, suggesting potential continuation of an uptrend.
- Break Down Signal: A red triangle above the bar indicates a breakout below a bullish FVG, suggesting potential continuation of a downtrend.
- Exit Up/Down Signal: A green/red circle indicates an exit from an FVG without a full breakout, which may signal the end of a correction or preparation for a reversal.
- FVG Zones: If the price returns to an FVG and fills the gap, it may indicate equilibrium; an unfilled gap often leads to a retest.
- Use signals in conjunction with other technical analysis tools for confirmation, such as RSI (to identify overbought/oversold conditions) or MACD (to confirm momentum). Analyze FVGs from higher timeframes—these zones act as stronger imbalance levels and carry greater structural significance.
Exit signals (retests without breakouts) tend to be most effective when traded in line with the current trend.
█ APPLICATIONS
- Price Action Trading: Use FVG zones as dynamic support and resistance levels. In an uptrend, look for buying opportunities in bullish FVGs, where price often tests the gap before continuing. Combining with RSI, MACD, or Fibonacci levels enhances the significance of zones.
- Breakout Strategies: Trade based on breakout signals from FVGs. A buy signal after breaking a bearish FVG may indicate a strong upward impulse, especially when supported by a rising MACD or RSI exiting oversold conditions.
Larger FVG gaps (higher multiplier) have a greater chance of retest, as they indicate deeper imbalances.
█ NOTES
- Test the indicator across different timeframes and markets (stocks, forex, crypto) to optimize size filters for your trading style.
- The indicator initializes historical FVGs up to 500 candles back, which may slow loading on longer charts.
- For best results, use on high-liquidity markets where FVGs are more frequently retested.
- In consolidation zones, the indicator may generate more false signals, so additional confirmation is recommended.

Triple Confirmation StrategyTriple Confirmation Strategy (TCS)
This indicator combines three different technical tools to provide more reliable entry signals:
RSI + Moving Average crossover → momentum confirmation
MACD line & signal crossover → trend direction signal
OBV + EMA crossover → volume-based confirmation
A signal is valid only if all three conditions occur within a given number of bars (default: 5). Optionally, it can be set to trigger only when the third confirmation happens at the current bar.
✨ Features
BUY / SELL markers on the chart
Alertcondition support → alerts can be set instantly
Grouped settings (RSI, MACD, OBV, Logic)
Diagnostic overlay (WSCD-style): RSI, MACD, and OBV visualized on a normalized –100…100 scale for easier monitoring
🎯 Usage
Suitable for both intraday and swing trading with default settings.
Parameters are fully customizable (lookback periods, bar window, diagnostic overlay).
Signals should not be used as a standalone trading system but are most effective when combined with broader context and other forms of analysis.

Strategy Chameleon [theUltimator5]Have you ever looked at an indicator and wondered to yourself "Is this indicator actually profitable?" Well now you can test it out for yourself with the Strategy Chameleon!
Strategy Chameleon is a versatile, signal-agnostic trading strategy designed to adapt to any external indicator or trading system. Like a chameleon changes colors to match its environment, this strategy adapts to match any buy/sell signals you provide, making it the ultimate backtesting and automation tool for traders who want to test multiple strategies without rewriting code.
🎯 Key Features
1) Connects ANY external indicator's buy/sell signals
Works with RSI, MACD, moving averages, custom indicators, or any Pine Script output
Simply connect your indicator's signal output to the strategy inputs
2) Multiple Stop Loss Types:
Percentage-based stops
ATR (Average True Range) dynamic stops
Fixed point stops
3) Advanced Trailing Stop System:
Percentage trailing
ATR-based trailing
Fixed point trailing
4) Flexible Take Profit Options:
Risk:Reward ratio targeting
Percentage-based profits
ATR-based profits
Fixed point profits
5) Trading Direction Control
Long Only - Bull market strategies
Short Only - Bear market strategies
Both - Full market strategies
6) Time-Based Filtering
Optional trading session restrictions
Customize active trading hours
Perfect for day trading strategies
📈 How It Works
Signal Detection: The strategy monitors your connected buy/sell signals
Entry Logic: Executes trades when signals trigger during valid time periods
Risk Management: Automatically applies your chosen stop loss and take profit levels
Trailing System: Dynamically adjusts stops to lock in profits
Performance Tracking: Real-time statistics table showing win rate and performance
⚙️ Setup Instructions
0) Add indicator you want to test, then add the Strategy to your chart
Connect Your Signals:
imgur.com
Go to strategy settings → Signal Sources
1) Set "Buy Signal Source" to your indicator's buy output
2) Set "Sell Signal Source" to your indicator's sell output
3) Choose table position - This simply changes the table location on the screen
4) Set trading direction preference - Buy only? Sell only? Both directions?
imgur.com
5) Set your preferred stop loss type and level
You can set the stop loss to be either percentage based or ATR and fully configurable.
6) Enable trailing stops if desired
imgur.com
7) Configure take profit settings
8) Toggle time filter to only consider specific time windows or trading sessions.
🚀 Use Cases
Test various indicators to determine feasibility and/or profitability.
Compare different signal sources quickly
Validate trading ideas with consistent risk management
Portfolio Management
Apply uniform risk management across different strategies
Standardize stop loss and take profit rules
Monitor performance consistently
Automation Ready
Built-in alert conditions for automated trading
Compatible with trading bots and webhooks
Easy integration with external systems
⚠️ Important Notes
This strategy requires external signals to function
Default settings use 10% of equity per trade
Pyramiding is disabled (one position at a time)
Strategy calculates on bar close, not every tick
🔗 Integration Examples
Works perfectly with:
RSI strategies (connect RSI > 70 for sells, RSI < 30 for buys)
Moving average crossovers
MACD signal line crosses
Bollinger Band strategies
Custom oscillators and indicators
Multi-timeframe strategies
📋 Default Settings
Position Size: 10% of equity
Stop Loss: 2% percentage-based
Trailing Stop: 1.5% percentage-based (enabled)
Take Profit: Disabled (optional)
Trade Direction: Both long and short
Time Filter: Disabled

Universal Renko Bars by SiddWolfUniversal Renko Bars or UniRenko Bars is an overlay indicator that applies the logic of Renko charting directly onto a standard candlestick chart. It generates a sequence of price-driven bricks, where each new brick is formed only when the price moves a specific amount, regardless of time. This provides a clean, price-action-focused visualization of the market's trend.
WHAT IS UNIVERSAL RENKO BARS?
For years, traders have faced a stark choice: the clean, noise-free world of Renko charts, or the rich, time-based context of Candlesticks. Choosing Renko meant giving up your favorite moving averages, volume profiles, and the fundamental sense of time. Choosing Candlesticks meant enduring the market noise that often clouds true price action.
But what if you didn't have to choose?
Universal Renko Bars is a revolutionary indicator that ends this dilemma. It's not just another charting tool; it's a powerful synthesis that overlays the pure, price-driven logic of Renko bricks directly onto your standard candlestick chart. This hybrid approach gives you the best of both worlds:
❖ The Clarity of Renko: By filtering out the insignificant noise of time, Universal Renko reveals the underlying trend with unparalleled clarity. Up trends are clean successions of green bricks; down trends are clear red bricks. No more guesswork.
❖ The Context of Candlesticks: Because the Renko logic is an overlay, you retain your time axis, your volume data, and full compatibility with every other time-based indicator in your arsenal (RSI, MACD, Moving Averages, etc.).
The true magic, however, lies in its live, Unconfirmed Renko brick. This semi-transparent box is your window into the current bar's real-time struggle. It grows, shrinks, and changes color with every tick, showing you exactly how close the price is to confirming the trend or forcing a reversal. It’s no longer a lagging indicator; it’s a live look at the current battle between buyers and sellers.
Universal Renko Bars unifies these two powerful charting methods, transforming your chart into a more intelligent, noise-free, and predictive analytical canvas.
HOW TO USE
To get the most out of Universal Renko Bars, here are a few tips and a full breakdown of the settings.
Initial Setup for the Best Experience
For the cleanest possible view, it's highly recommended that you hide the body of your standard candlesticks, that shows only the skelton of the candle. This allows the Renko bricks to become the primary focus of your chart.
→ Double click on the candles and uncheck the body checkbox.
Settings Breakdown
The indicator is designed to be powerful yet intuitive. The settings are grouped to make customization easy.
First, What is a "Tick"?
Before we dive in, it's important to understand the concept of a "Tick." In Universal Renko, a Tick is not the same as a market tick. It's a fundamental unit of price movement that you define. For example, if you set the Tick Size to $0.50, then a price move of $1.00 is equal to 2 Ticks. This is the core building block for all Renko bricks. Tick size here is dynamically determined by the settings provided in the indicator.
❖ Calculation Method (The "Tick Size" Engine)
This section determines the monetary value of a single "Tick."
`Calculation Method` : Choose your preferred engine for defining the Tick Size.
`ATR Based` (Default): The Tick Size becomes dynamic, based on market volatility (Average True Range). Bricks will get larger in volatile markets and smaller in quiet ones. Use the `ATR 14 Multiplier` to control the sensitivity.
`Percentage` : The Tick Size is a simple percentage of the current asset price, controlled by the `Percent Size (%)` input.
`Auto` : The "set it and forget it" mode. The script intelligently calculates a Tick Size based on the asset's price. Use the `Auto Sensitivity` slider to make these automatically calculated bricks thicker (value > 1.0) or thinner (value < 1.0).
❖ Parameters (The Core Renko Engine)
This group controls how the bricks are constructed based on the Tick Size.
`Tick Trend` : The number of "Ticks" the price must move in the same direction to print a new continuation brick. A smaller value means bricks form more easily.
`Tick Reversal` : The number of "Ticks" the price must move in the opposite direction to print a new reversal brick. This is typically set higher than `Tick Trend` (e.g., double) to filter out minor pullbacks and market noise.
`Open Offset` : Controls the visual overlap of the bricks. A value of `0` creates gapless bricks that start where the last one ended. A value of `2` (with a `Tick Reversal` of 4) creates the classic 50% overlap look.
❖ Visuals (Controlling What You See)
This is where you tailor the chart to your visual preference.
`Show Confirmed Renko` : Toggles the solid-colored, historical bricks. These are finalized and will never change. They represent the confirmed past trend.
`Show Unconfirmed Renko` : This is the most powerful visual feature. It toggles the live, semi-transparent box that represents the developing brick. It shows you exactly where the price is right now in relation to the levels needed to form the next brick.
`Show Max/Min Levels` : Toggles the horizontal "finish lines" on your chart. The green line is the price target for a bullish brick, and the red line is the target for a bearish brick. These are excellent for spotting breakouts.
`Show Info Label` : Toggles the on-chart label that provides key real-time stats:
🧱 Bricks: The total count of confirmed bricks.
⏳ Live: How many chart bars the current live brick has been forming. These bars forms the Renko bricks that aren't confirmed yet. Live = 0 means the latest renko brick is confirmed.
🌲 Tick Size: The current calculated value of a single Tick.
Hover over the label for a tooltip with live RSI(14), MFI(14), and CCI(20) data for additional confirmation.
TRADING STRATEGIES & IDEAS
Universal Renko Bars isn't just a visual tool; it's a foundation for building robust trading strategies.
Trend Confirmation: The primary use is to instantly identify the trend. A series of green bricks indicates a strong uptrend; a series of red bricks indicates a strong downtrend. Use this to filter out trades that go against the primary momentum.
Reversal Spotting: Pay close attention to the Unconfirmed Brick . When a strong trend is in place and the live brick starts to fight against it—changing color and growing larger—it can be an early warning that a reversal is imminent. Wait for the brick to be confirmed for a higher probability entry.
Breakout Trading: The `Max/Min Levels` are your dynamic breakout zones. A long entry can be considered when the price breaks and closes above the green Max Level, confirming a new bullish brick. A short entry can be taken when price breaks below the red Min Level.
Confluence & Indicator Synergy: This is where Universal Renko truly shines. Overlay a moving average (e.g., 20 EMA). Only take long trades when the green bricks are forming above the EMA. Combine it with RSI or MACD; a bearish reversal brick forming while the RSI shows bearish divergence is a very powerful signal.
A FINAL WORD
Universal Renko Bars was designed to solve a fundamental problem in technical analysis. It brings together the best elements of two powerful methodologies to give you a clearer, more actionable view of the market. By filtering noise while retaining context, it empowers you to make decisions with greater confidence.
Add Universal Renko Bars to your chart today and elevate your analysis. We welcome your feedback and suggestions for future updates!
Follow me to get notified when I publish New Indicator.
~ SiddWolf

Logistic Regression ICT FVG🚀 OVERVIEW
Welcome to the Logistic Regression Fair Value Gap (FVG) System — a next-gen trading tool that blends precision gap detection with machine learning intelligence.
Unlike traditional FVG indicators, this one evolves with each bar of price action, scoring and filtering gaps based on real market behavior.
🔧 CORE FEATURES
✨ Smart Gap Detection
Automatically identifies bullish and bearish Fair Value Gaps using volatility-aware candle logic.
📊 Probability-Based Filtering
Uses logistic regression to assign each gap a confidence score (0 to 1), showing only high-probability setups.
🔁 Real-Time Retest Tracking
Continuously watches how price interacts with each gap to determine if it deserves respect.
📈 Multi-Factor Assessment
Evaluates RSI, MACD, and body size at gap formation to build a full context snapshot.
🧠 Self-Learning Engine
The logistic regression model updates on each bar using gradient descent, refining its predictions over time.
📢 Built-In Alerts
Get instant alerts when a gap forms, gets retested, or breaks.
🎨 Custom Display Options
Control the color of bullish/bearish zones, and toggle on/off probability labels for cleaner charts.
🚩 WHAT MAKES IT DIFFERENT
This isn’t just another box-drawing indicator.
While others mark every imbalance, this system thinks before it draws — using statistical modeling to filter out noise and prioritize high-impact zones.
By learning from how price behaves around gaps (not just how they form), it helps you trade only what matters — not what clutters.
⚙️ HOW IT WORKS
1️⃣ Detection
FVGs are identified using ATR-based thresholds and sharp wick imbalances.
2️⃣ Behavior Monitoring
Every gap is tracked — and if respected enough times, it becomes part of the elite training set.
3️⃣ Context Capture
Each new FVG logs RSI, MACD, and body size to provide a feature-rich context for prediction.
4️⃣ Prediction (Logistic Regression)
The model predicts how likely the gap is to be respected and assigns it a probability score.
5️⃣ Classification & Alerts
Gaps above the threshold are plotted with score labels, and alerts trigger for entry/respect/break.
⚙️ CONFIGURATION PANEL
🔧 System Inputs
• Max Retests – How many times a gap must be respected to train the model
• Prediction Threshold – Minimum score to show a gap on the chart
• Learning Rate – Controls how fast the model adapts (default: 0.009)
• Max FVG Lifetime – Expiration duration for unused gaps
• Show Historic Gaps – Show/hide expired or invalidated gaps
🎨 Visual Options
• Bullish/Bearish Colors – Set gap colors to fit your chart style
• Confidence Labels – Show probability scores next to FVGs
• Alert Toggles – Enable alerts for:
– New FVG detected
– FVG respected (entry)
– FVG invalidated (break)
💡 WHY LOGISTIC REGRESSION?
Traditional FVG tools rely on candle shapes.
This system relies on probability — by training on RSI, MACD, and price behavior, it predicts whether a gap will act as a true liquidity zone.
Logistic regression lets the system continuously adapt using new data, making it more accurate the longer it runs.
That means smarter signals, fewer false positives, and a clearer view of where real opportunities lie.

Combined ATR + VolumeOverview
The Combined ATR + Volume indicator (C-ATR+Vol) is designed to measure both price volatility and market participation by merging the Average True Range (ATR) and trading volume into a single normalized value. This provides traders with a more comprehensive tool than ATR alone, as it highlights not only how much price is moving, but also whether there is sufficient volume behind those moves.
Originality & Utility
Two Key Components
ATR (Average True Range): Measures price volatility by analyzing the range (high–low) over a specified period. A higher ATR often indicates larger price swings.
Volume: Reflects how actively traders are participating in the market. High volume typically indicates strong buying or selling interest.
Normalized Combination
Both ATR and volume are independently normalized to a 0–100 range.
The final output (C-ATR+Vol) is the average of these two normalized values. This makes it easy to see when both volatility and market participation are relatively high.
Practical Use
Above 80: Signifies elevated volatility and strong volume. Markets may experience significant moves.
Around 50–80: Indicates moderate activity. Price swings and volume are neither extreme nor minimal.
Below 50: Suggests relatively low volatility and lower participation. The market may be ranging or consolidating.
This combined approach can help filter out situations where volatility is high but volume is absent—or vice versa—providing a more reliable context for potential breakouts or trend continuations.
Indicator Logic
ATR Calculation
Uses Pine Script’s built-in ta.tr(true) function to measure true range, then smooths it with a user-selected method (RMA, SMA, EMA, or WMA).
Key Input: ATR Length (default 14).
Volume Calculation
Smooths the built-in volume variable using the same selectable smoothing methods.
Key Input: Volume Length (default 14).
Normalization
For each metric (ATR and Volume), the script finds the lowest and highest values over the lookback period and converts them into a 0–100 scale:
normalized value
=(current value−min)(max−min)×100
normalized value= (max−min)(current value−min) ×100
Combined Score
The final plot is the average of Normalized ATR and Normalized Volume. This single value simplifies the process of identifying high-volatility, high-volume conditions.
How to Use
Setup
Add the indicator to your chart.
Adjust ATR Length, Volume Length, and Smoothing to match your preferred time horizon or chart style.
Interpretation
High Values (above 80): The market is experiencing significant price movement with high participation. Potential for strong trends or breakouts.
Moderate Range (50–80): Conditions are active but not extreme. Trend setups may be forming.
Low Values (below 50): Indicates quieter markets with reduced liquidity. Expect ranging or less decisive moves.
Strategy Integration
Use C-ATR+Vol alongside other trend or momentum indicators (e.g., Moving Averages, RSI, MACD) to confirm potential entries/exits.
Combine it with support/resistance or price action analysis for a broader market view.
Important Notes
This script is open-source and intended as a community contribution.
No Future Guarantee: Past market behavior does not guarantee future results. Always use proper risk management and validate signals with additional tools.
The indicator’s performance may vary depending on timeframes, asset classes, and market conditions.
Adjust inputs as needed to suit different instruments or personal trading styles.
By adhering to TradingView’s publishing rules, this script is provided with sufficient detail on what it does, how it’s unique, and how traders can use it. Feel free to customize the settings and experiment with other technical indicators to develop a trading methodology that fits your objectives.
🔹 Combined ATR + Volume (C-ATR+Vol) 지표 설명
이 인디케이터는 ATR(Average True Range)와 거래량(Volume)을 결합하여 시장의 변동성과 유동성을 동시에 측정하는 지표입니다.
ATR은 가격 변동성의 크기를 나타내며, 거래량은 시장 참여자의 활동 수준을 반영합니다. 보통 높은 ATR은 가격 변동이 크다는 의미이고, 높은 거래량은 시장에서 적극적인 거래가 이루어지고 있음을 나타냅니다.
이 두 지표를 각각 0~100 범위로 정규화한 후, 평균을 구하여 "Combined ATR + Volume (C-ATR+Vol)" 값을 계산합니다.
이를 통해 단순한 가격 변동성뿐만 아니라 거래량까지 고려하여, 더욱 신뢰성 있는 변동성 판단을 할 수 있도록 도와줍니다.
📌 핵심 개념
1️⃣ ATR (Average True Range)란?
시장의 변동성을 측정하는 지표로, 일정 기간 동안의 고점-저점 변동폭을 기반으로 계산됩니다.
ATR이 높을수록 가격 변동이 크며, 낮을수록 횡보장이 지속될 가능성이 큽니다.
하지만 ATR은 방향성을 제공하지 않으며, 단순히 변동성의 크기만을 나타냅니다.
2️⃣ 거래량 (Volume)의 역할
거래량은 시장 참여자의 관심과 유동성을 반영하는 중요한 요소입니다.
높은 거래량은 강한 매수 또는 매도세가 존재함을 의미하며, 낮은 거래량은 시장 참여가 적거나 관심이 줄어들었음을 나타냅니다.
3️⃣ ATR + 거래량의 결합 (C-ATR+Vol)
단순한 ATR 값만으로는 변동성이 커도 거래량이 부족할 수 있으며, 반대로 거래량이 많아도 변동성이 낮을 수 있습니다.
이를 해결하기 위해 ATR과 거래량을 각각 0~100으로 정규화하여 균형 잡힌 변동성 지표를 만들었습니다.
두 지표의 평균값을 계산하여, 가격 변동과 거래량이 동시에 높은지를 측정할 수 있도록 설계되었습니다.
📊 사용법 및 해석
80 이상 → 강한 변동성 구간
가격 변동성이 크고 거래량도 높은 상태
강한 추세가 진행 중이거나 큰 변동이 일어날 가능성이 큼
상승/하락 방향성을 확인한 후 트렌드를 따라가는 전략이 유리
50~80 구간 → 보통 수준의 변동성
가격 움직임이 일정하며, 거래량도 적절한 수준
점진적인 추세 형성이 이루어질 가능성이 있음
시장이 점진적으로 상승 혹은 하락할 가능성이 크므로, 보조지표를 활용하여 매매 타이밍을 결정하는 것이 중요
50 이하 → 낮은 변동성 및 유동성 부족
가격 변동이 적고, 거래량도 낮은 상태
시장이 횡보하거나 조정 기간에 들어갈 가능성이 큼
박스권 매매(지지/저항 활용) 또는 돌파 전략을 고려할 수 있음
💡 활용 방법 및 전략
✅ 1. 트렌드 판단 보조지표로 활용
단독으로 사용하는 것보다는 RSI, MACD, 이동평균선(MA) 등의 지표와 함께 활용하는 것이 효과적입니다.
예를 들어, MACD가 상승 신호를 주고, C-ATR+Vol 값이 80을 초과하면 강한 상승 추세로 해석할 수 있습니다.
✅ 2. 변동성 돌파 전략에 활용
C-ATR+Vol이 80 이상인 구간에서 가격이 특정 저항선을 돌파한다면, 강한 추세의 시작을 의미할 수 있습니다.
반대로, C-ATR+Vol이 50 이하에서 가격이 저항선에 가까워지면 돌파 가능성이 낮아질 수 있습니다.
✅ 3. 시장 참여도와 변동성 확인
단순히 ATR만 높아서는 신뢰하기 어려운 경우가 많습니다. 예를 들어, 급등 후 거래량이 급감하면 상승 지속 가능성이 낮아질 수도 있습니다.
하지만 C-ATR+Vol을 사용하면 거래량이 함께 증가하는지를 확인하여 보다 신뢰할 수 있는 분석이 가능합니다.
🚀 결론
🔹 Combined ATR + Volume (C-ATR+Vol) 인디케이터는 단순한 ATR이 아니라 거래량까지 고려하여 변동성을 측정하는 강력한 도구입니다.
🔹 시장이 큰 움직임을 보일 가능성이 높은 구간을 찾는 데 유용하며, 80 이상일 경우 강한 변동성이 있음을 나타냅니다.
🔹 단독으로 사용하기보다는 보조지표와 함께 활용하여, 트렌드 분석 및 돌파 전략 등에 효과적으로 적용할 수 있습니다.
📌 주의사항
변동성이 크다고 해서 반드시 가격이 급등/급락한다는 보장은 없습니다.
특정한 매매 전략 없이 단순히 이 지표만 보고 매수/매도를 결정하는 것은 위험할 수 있습니다.
시장 상황에 따라 변동성의 의미가 다르게 작용할 수 있으므로, 반드시 다른 보조지표와 함께 활용하는 것이 중요합니다.
🔥 이 지표를 활용하여 시장의 변동성과 거래량을 보다 효과적으로 분석해보세요! 🚀

[MAD] Weighted Trend Detector--> Purpose
The Weighted Trend Detector evaluates market direction by combining multiple technical indicators (RSI, MACD, Moving Averages, ADX, and Volume) across up to three different timeframes.
It calculates an overall trend score to help visualize whether conditions are bullish, bearish, or neutral.
--> Scaling & Weightings
Each component indicator contributes a score between -1.0 and +1.0. User-defined weights (e.g., 0.2 for RSI, 0.3 for MACD) determine how much each indicator influences the final score. An adaptive scaling mechanism ensures extreme values remain in view by dynamically setting the minimum and maximum of the score range over a specified lookback period.
--> Basic Parameters of Individual Indicators
RSI Period: Number of bars for the Relative Strength Index calculation; higher values smooth out noise but may lag.
MACD Fast/Slow/Signal: EMA-based periods to identify momentum shifts. A shorter “Fast” length reacts quickly, while a longer “Slow” length is smoother.
Moving Averages (Short & Long Lengths): Simple Moving Averages used to gauge shorter- vs. longer-term price direction.
ADX Length: Defines how many bars are considered when measuring trend strength. Higher values produce smoother ADX lines.
Volume MA Length: Period over which the average volume is calculated to compare against current volume.
--> Colors & How They Are Mixed
The background color scales from a negative color (for lower scores) to a positive color (for higher scores).
Near the highest or lowest parts of the score range, additional blending occurs if the slope (change in score) reverses:
Turning Down: Mixes with a user-chosen “warning” color if the score is high but moving lower.
Turning Up: Mixes with a user-chosen “recovery” color if the score is low but moving higher.
All colors (including line and label text) can be adjusted in the script’s inputs to suit personal preferences.colors are customizable via inputs.
Have fun :-)
